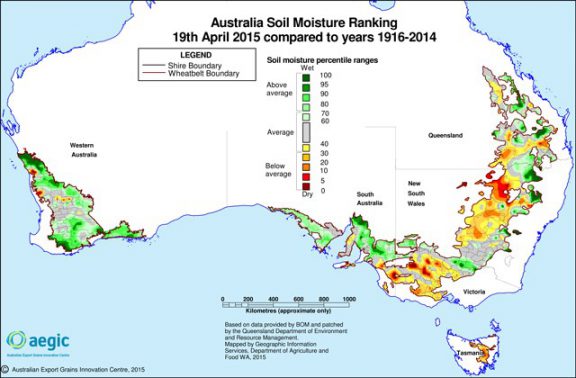
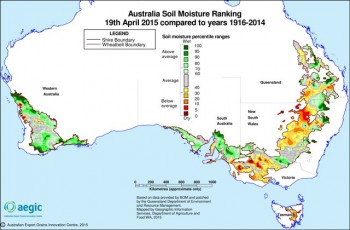
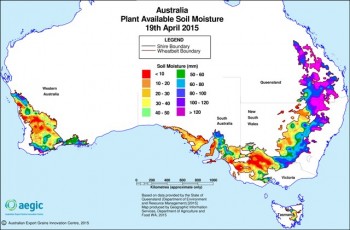
Map of Australian available soil moisture april 2015 vs 1916-2014
Australia soil moisture ranking percentile map –
19 April, 2015
Aust Soil Moisture 190415
Displays the ranking percentile for this year compared to the previous 99 years, at the same day of the year.
Plant available soil moisture (mm) map – 19 April, 2015
Displays the soil moisture in millimetres (mm).
PASM 190415
Calculate Our Impact

Calculate Our Impact

Our clients consistently receive above average prices for their crops.

Discover how much impact we would have on your returns.

Test our grain prices
Who We Help

We provide trusted advice for the returns you deserve

Our Achievements

We aim to market your grain in the top 10% of grain prices.

20M+
Tonnes transacted nationally
$35
Value added per tonne
2500+
Growers transacted on average

“Thanks to the excellent advice and strategic insights provided by Grain Brokers, I have been able to maximise my farmgate returns. I would highly recommend their grain marketing expertise to anyone looking to achieve similar results.”

Gordon - Kojonup, WA
Contact Us

Give us a call on our number below or send us an email with your name, contact details and enquiry.